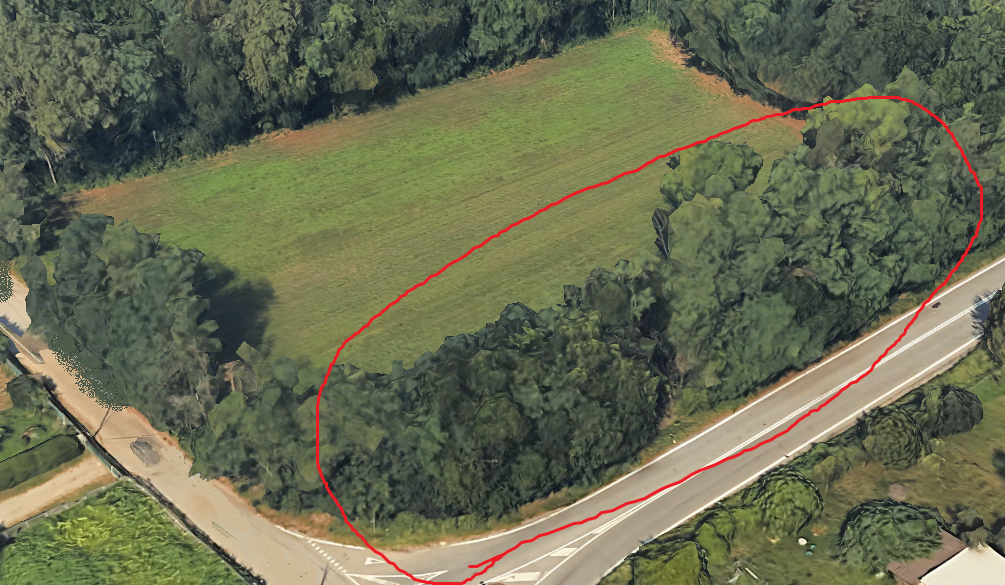
In this study samples were taken from 14 different individual Black Cherry trees belonging to a single patch of Black Locust and Black Cherry trees located in northern Italy. This is how the patch looked before felling:
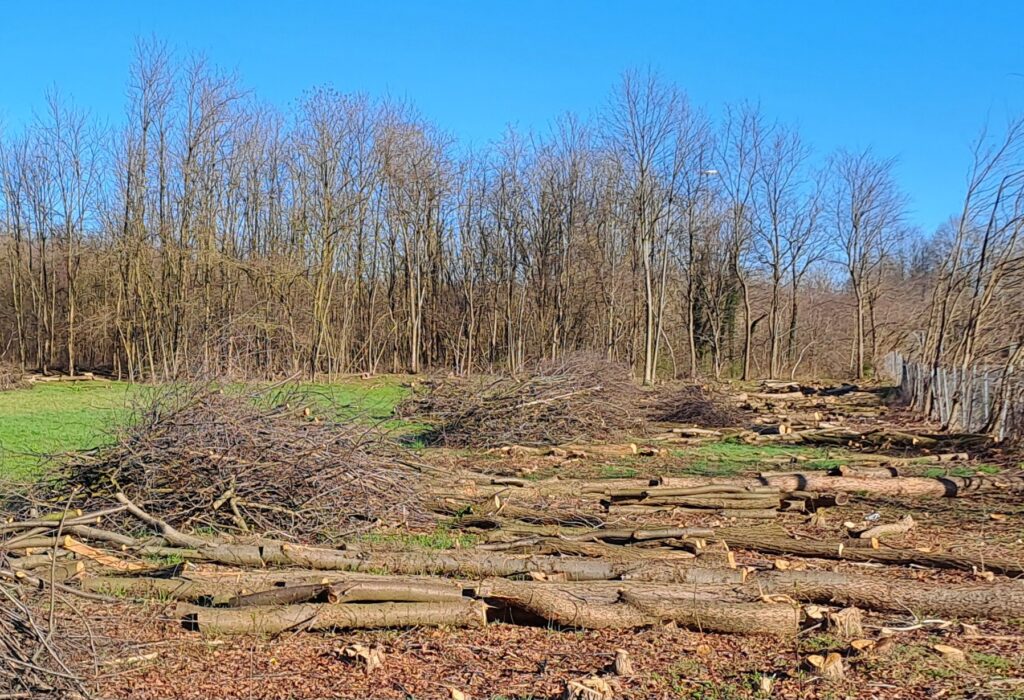
… and just after felling:
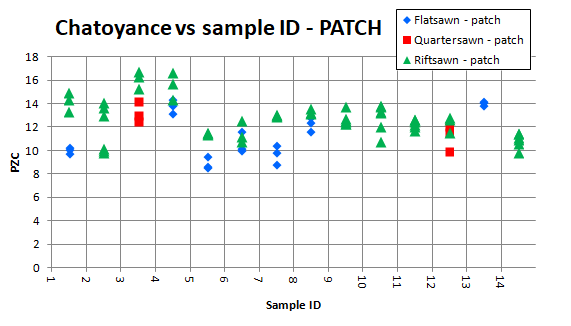
The chatoyance summary chart below shows that:
1) Data are relatively consistent within each individual tree
2) Riftsawn results are generally higher
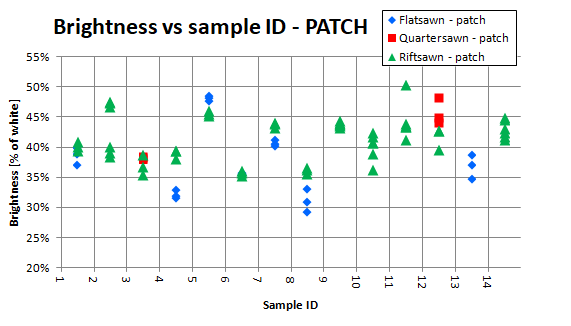
Surface brightness is also compared, showing again consistency within each tree, while samples out of some trees are significantly darker:
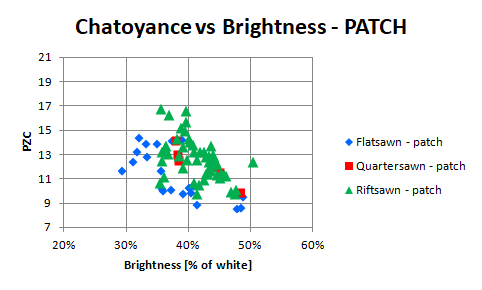
Chatoyance was compared to surface brightness showing that, in general, darker pieces appear slightly more chatoyant:
Data from this patch of trees were compared to data from 10 more individual trees located in the US.
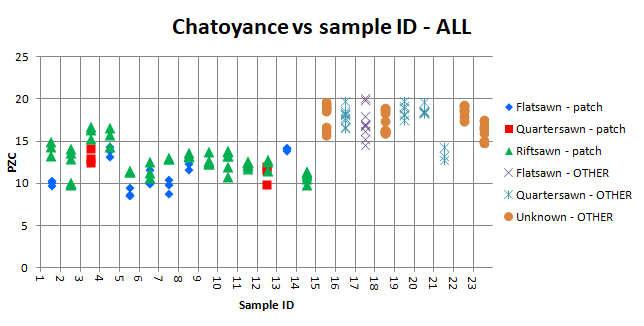
The chatoyance summary chart shows that
1) results from this patch are generally lower (average 12.3 vs average 17.6)
2) average on each individual tree within this patch ranges from 10.2 to 14.7, against a range of 13.5÷18.7 for other trees
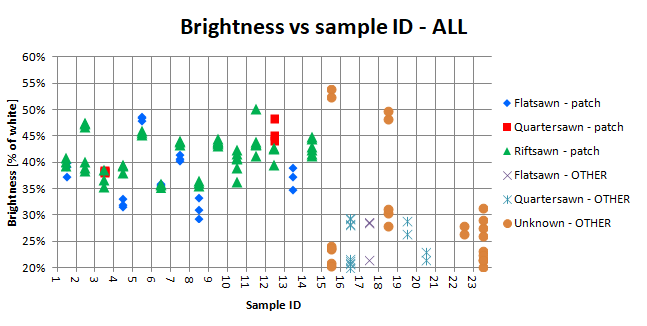
Brightness on this patch is also generally higher; could this be related to wood aging or oxidation?
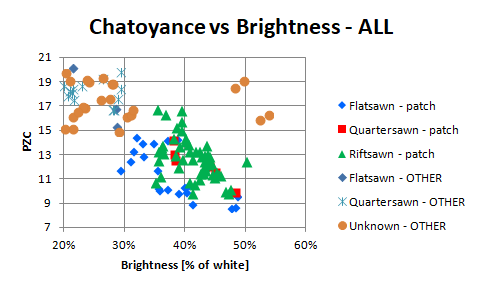
The general trend is again visible, even if less evident, on the whole population:
GIFs below provide some examples:


