The trip shown in this page provided some samples from different trees, ranging from large dead trees to small young trees. Here we analyze how visible chatoyance is distributed within the trees.
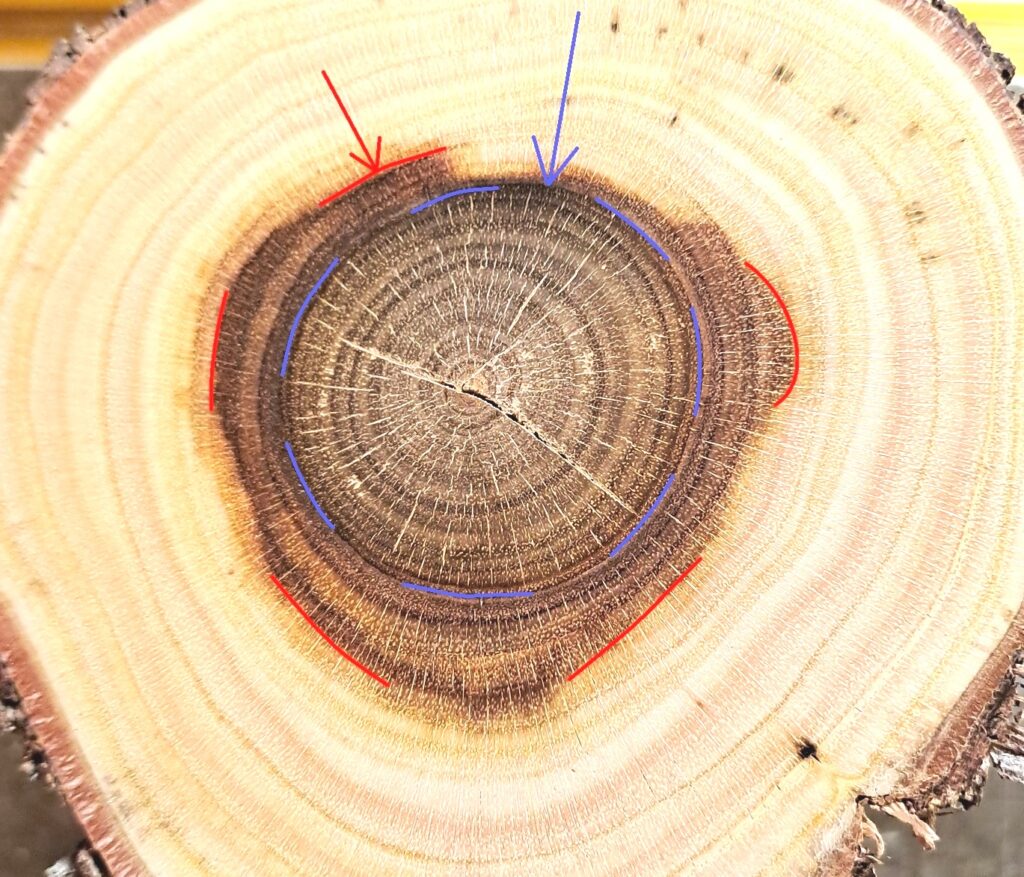
This Ø12cm log ting results: it shows a center grayish section well delimited on a growth ring by a black band (highlighted in blue) and a sapwood discoloration area (from whitish to brown – highlighted in red):
These areas were all investigated by dedicated sections, which are showed as animated gifs followed by chatoyance maps.
A section through the grayish hear reveals a relatively uniform high chatoyance, with the only non-chatoyant spot being the pith:


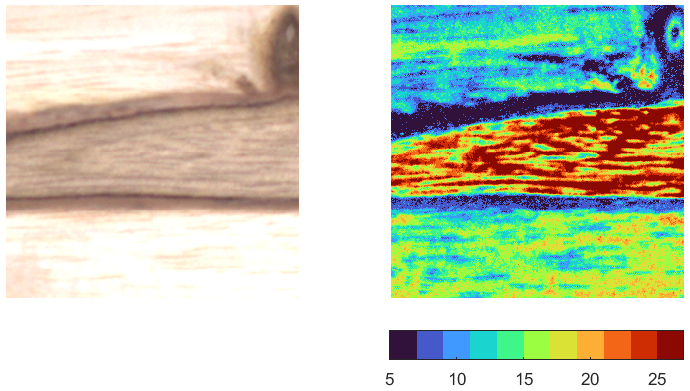
This section shows a flatsawn cut through the grayish heart and the black layer, with the former appearing highly chatoyant and the latter appearing non-chatoyant:


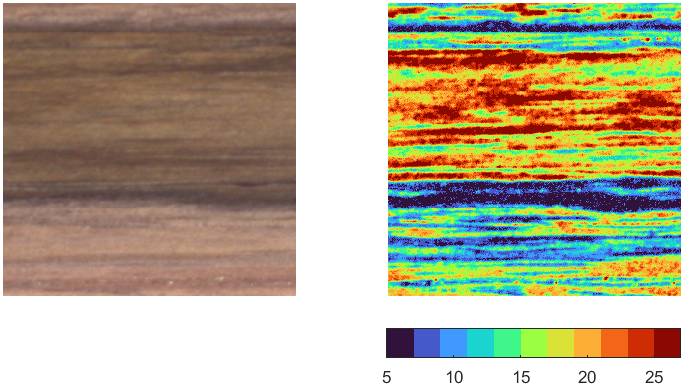
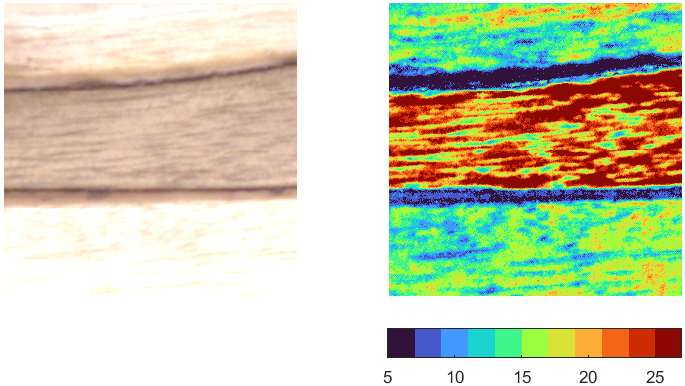
This is a more radial cross section, again showing good chatoyance in the core and in the brown area and very low chatoyance in the black layer:


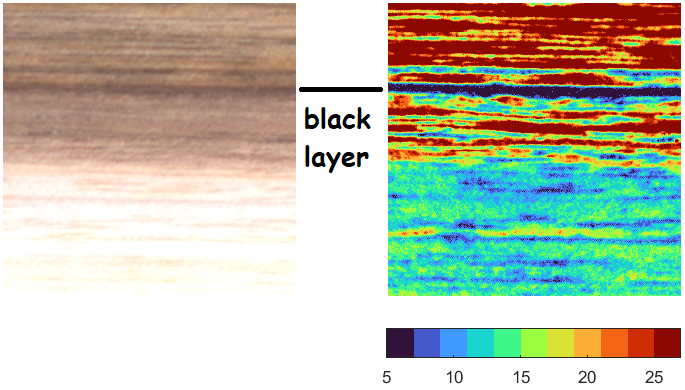
A tangential cut that only cuts through the brown layer does not show the black layer’s chatoyance pit:


Some more smaller logs were evaluated:
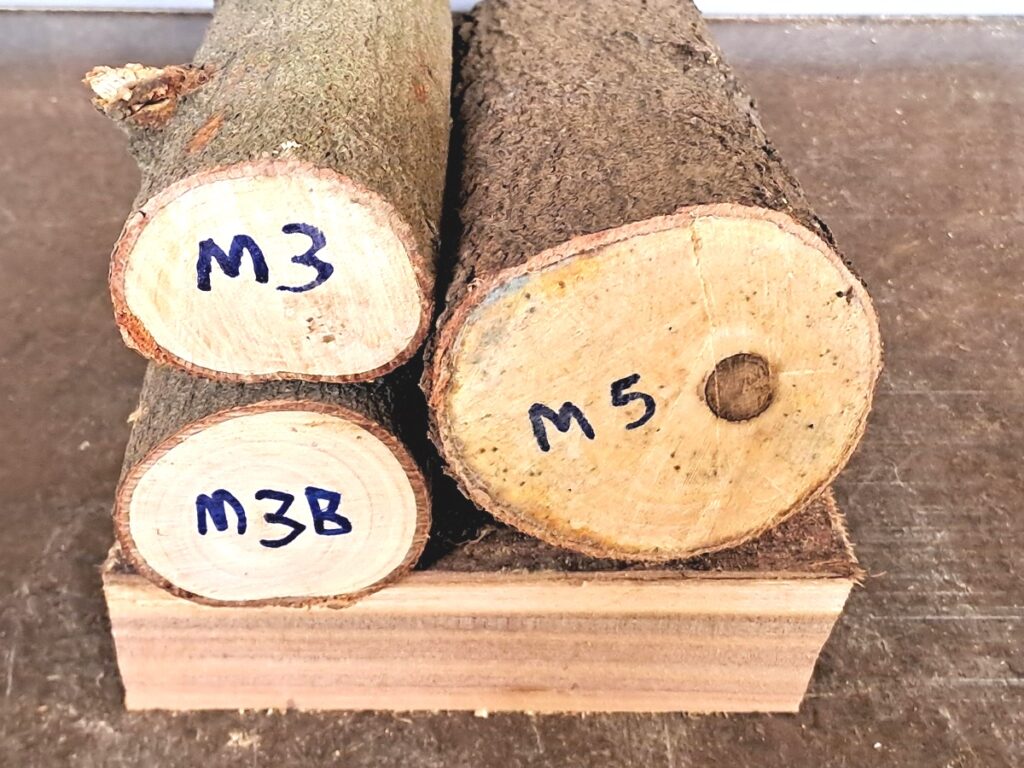
Similar results were seen on this younger tree (M5 in picture above) where the gray core is only about 15mm in diameter:


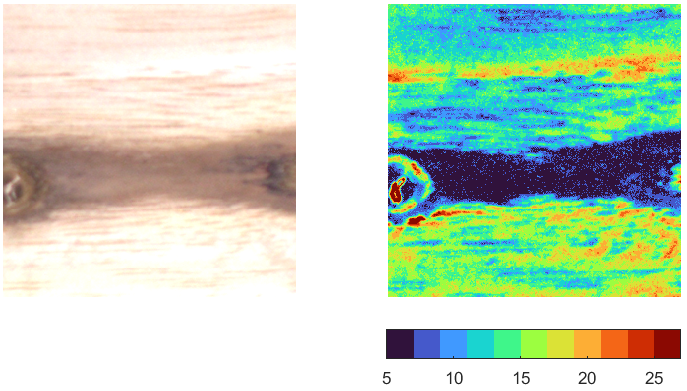
In this case it would look like both the black layer and the brown area are non chatoyant:
Sapwood chatoyance was also measured; these four samples come from four different individual trees:


The results are quite consistent.