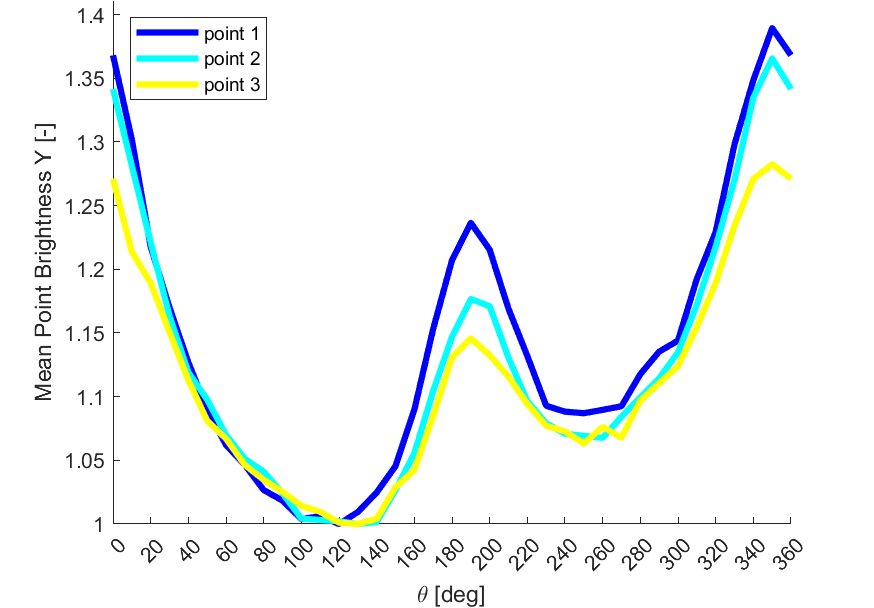
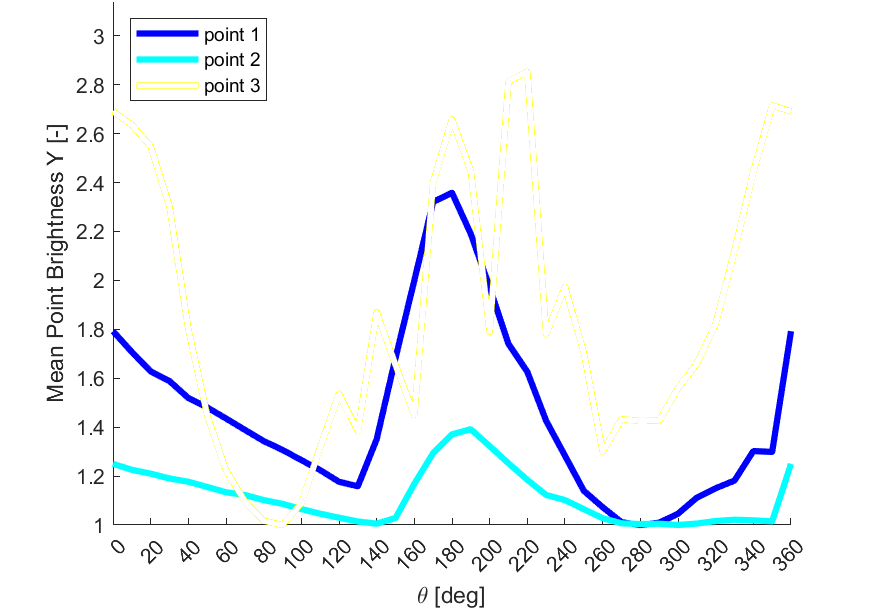
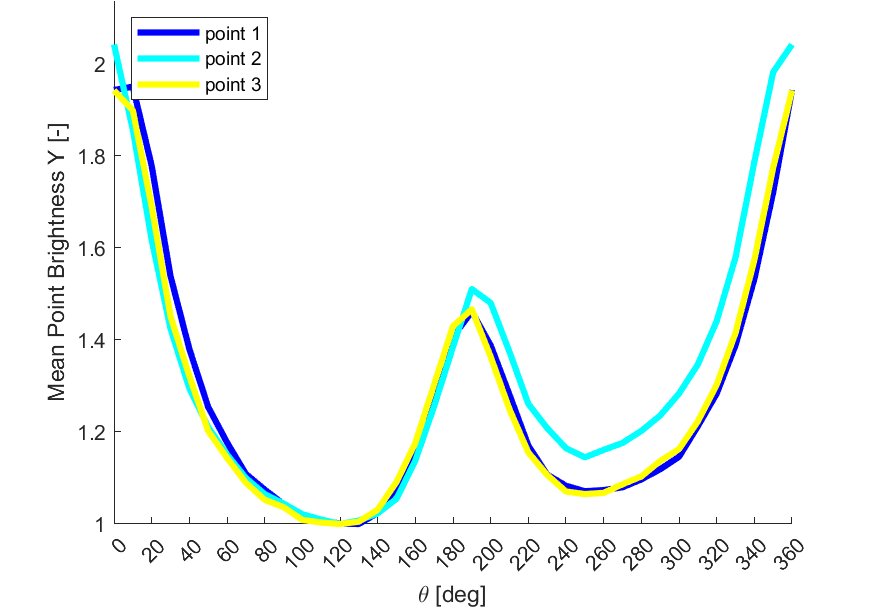
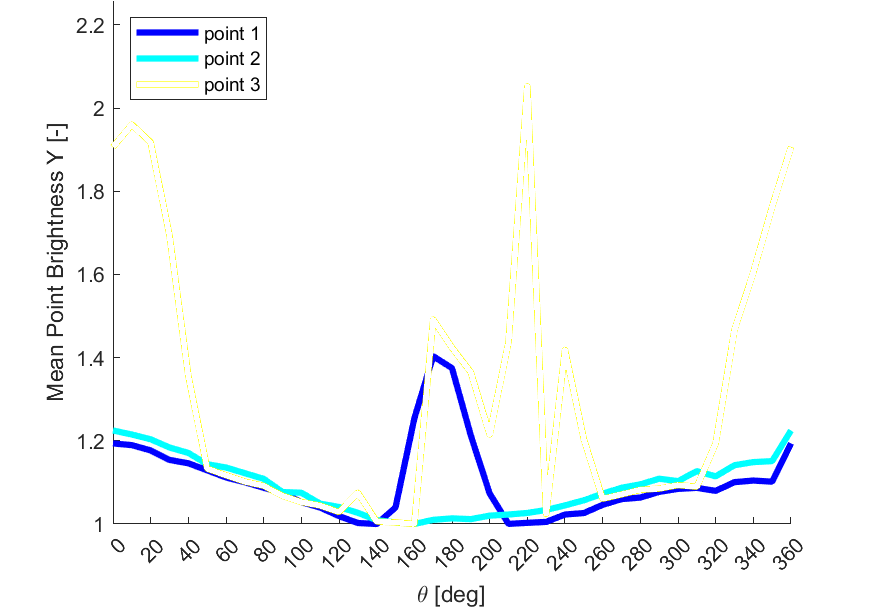
Two Black Locust samples were tested for chatoyance under a blacklight source. Results are shown below:


Unfortunately poor lighting conditions yielded poor-quality gifs; however, it is very interesting to look at chatoyance maps (these represent the ratio between max and min brightness during a 360° light orbitation):


While under normal light there is a clear pattern for brightness anisotropy corresponding to growth rings, under blacklight all areas appear to behave quite uniformly.
Finally, looking at brightness vs light orbitation angle (theta) charts the results appear quite different: setting aside “point 3” which provided messy results under blacklight, it appears that the charts still show some sort of “peaks”, although the shape is significantly different.


